
Lots of interesting abstracts and cases were submitted for TCTAP 2022. Below are the accepted ones after a thorough review by our official reviewers. Don’t miss the opportunity to expand your knowledge and interact with authors as well as virtual participants by sharing your opinion in the comment section!
TCTAP A-039
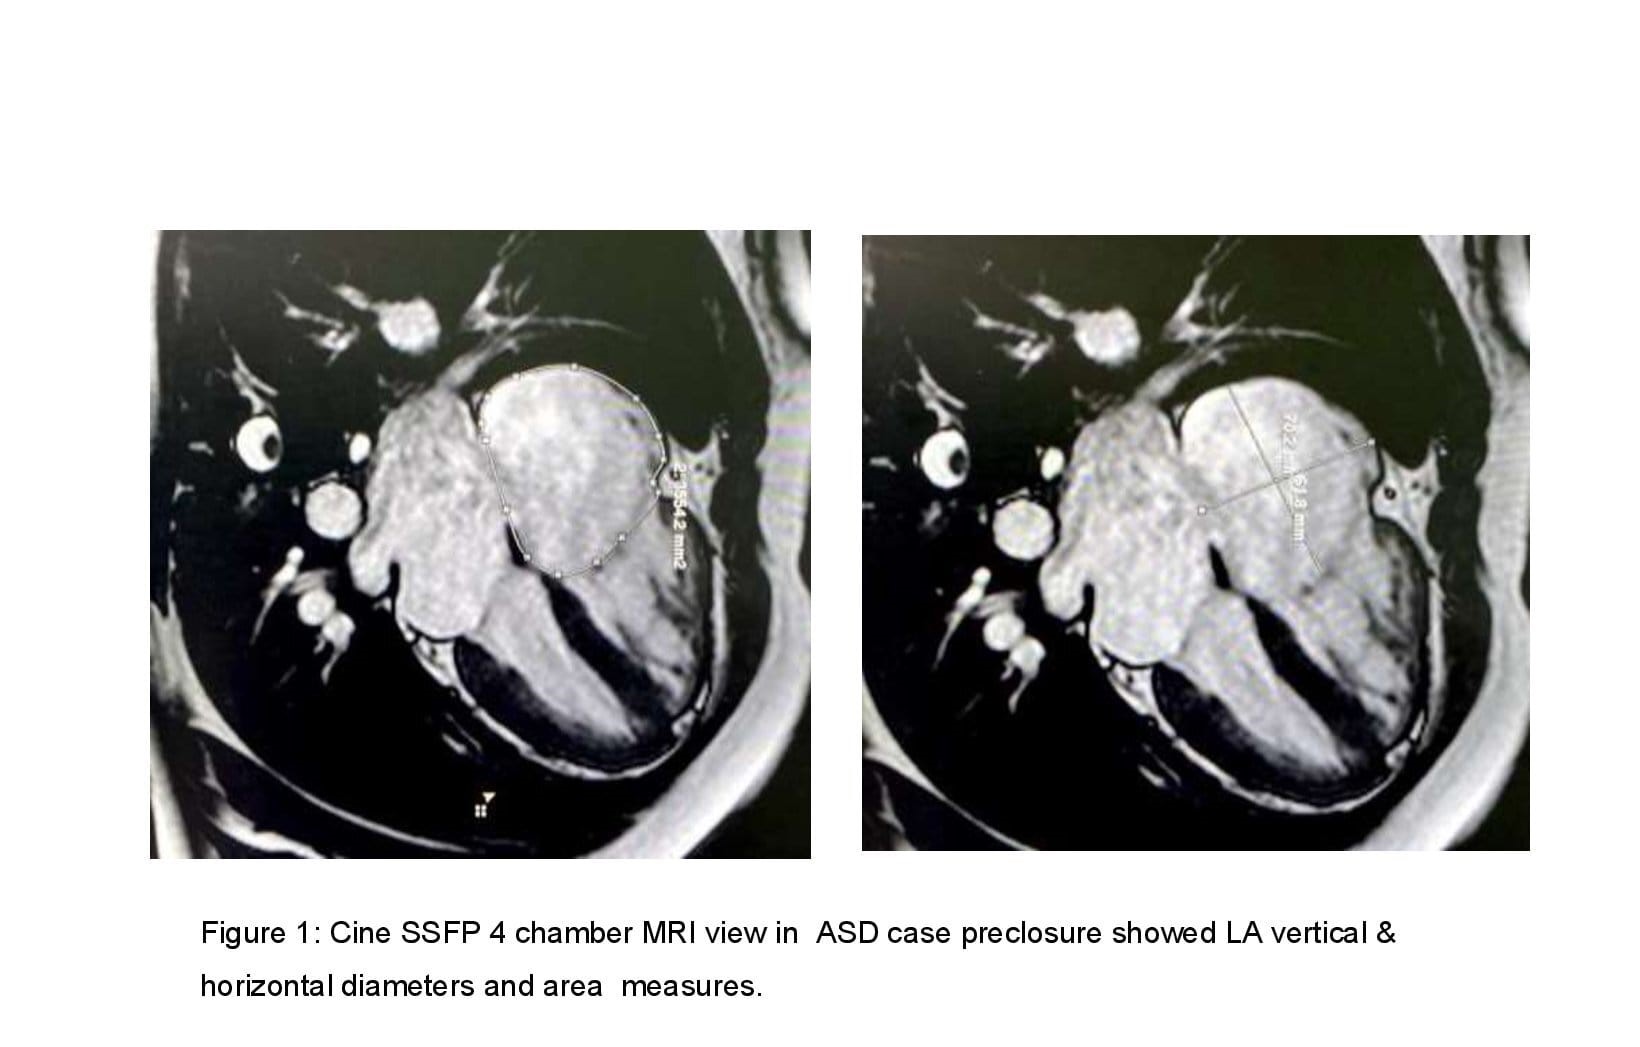
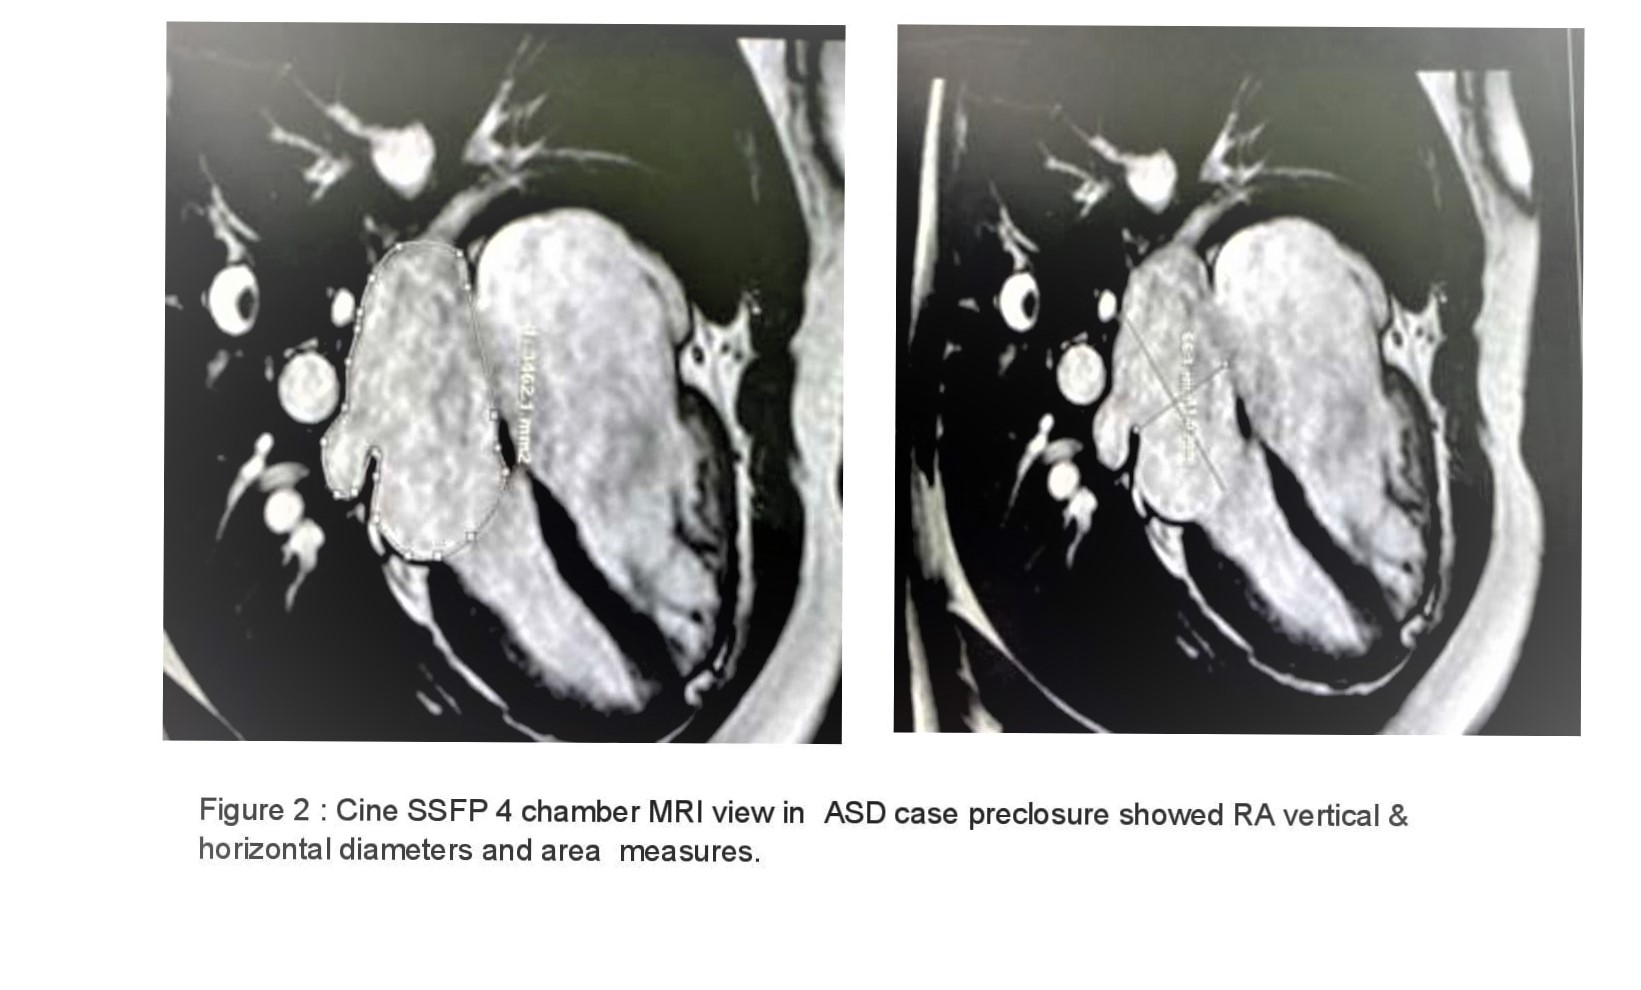
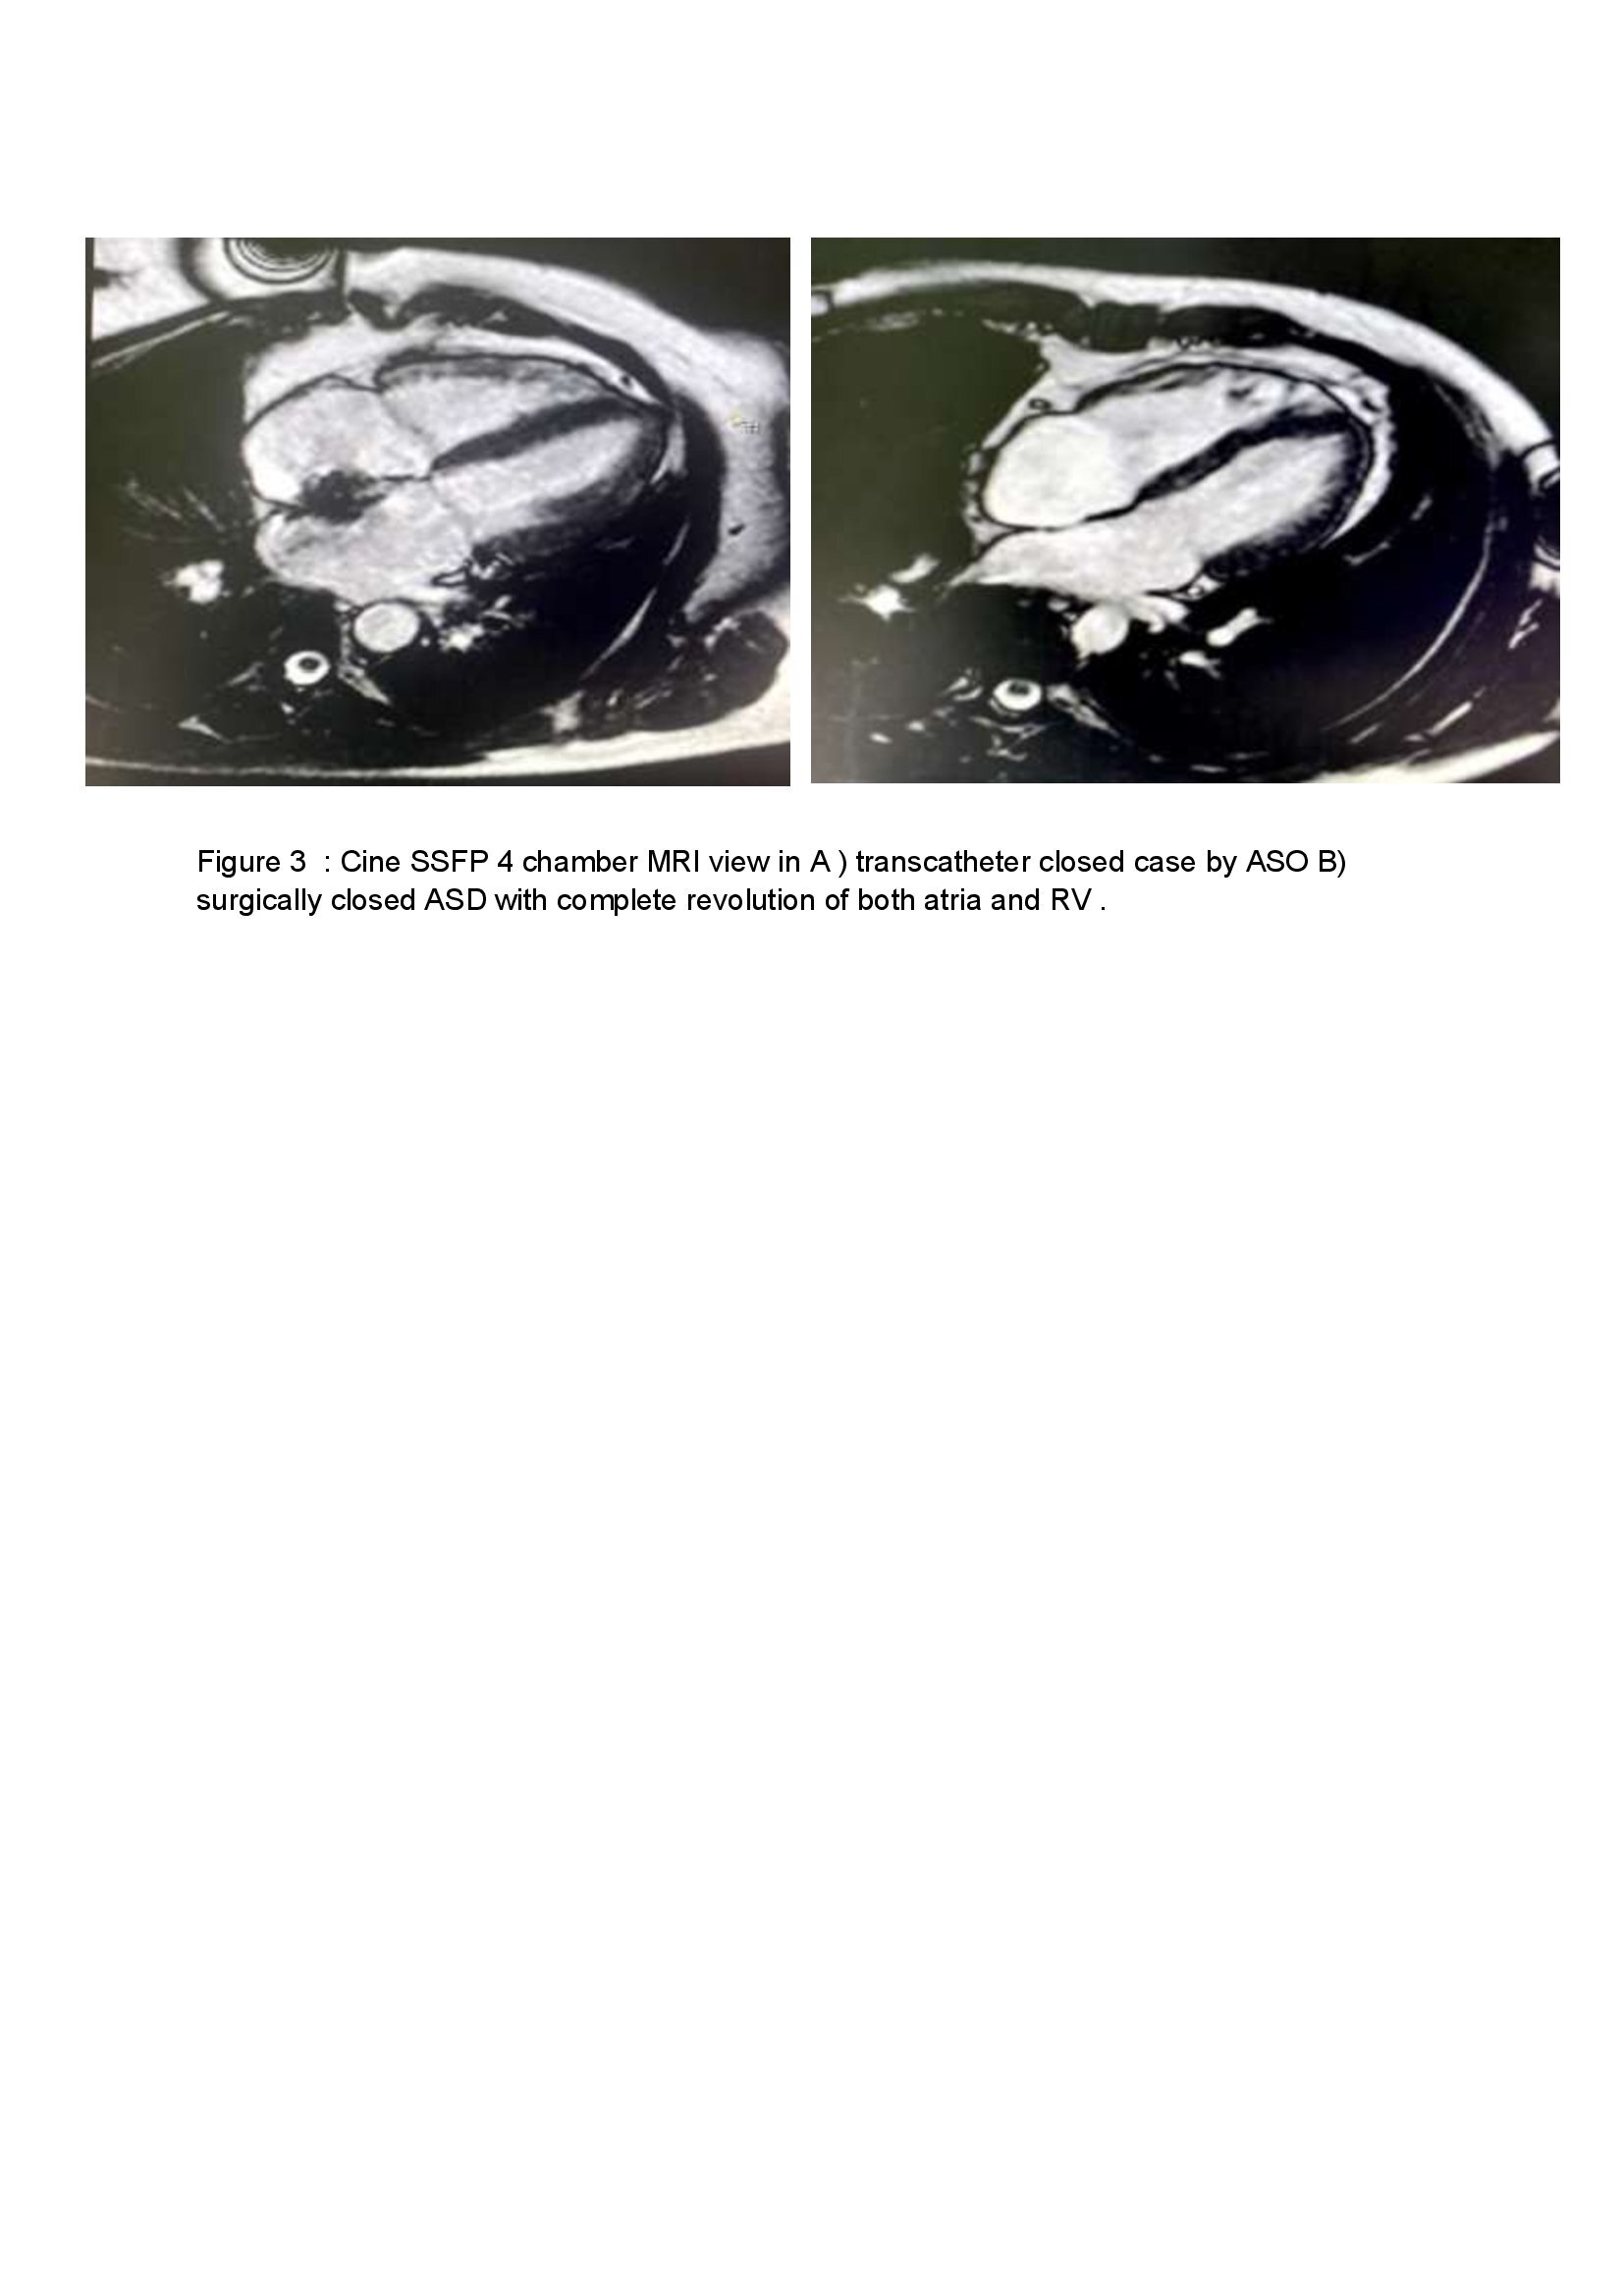
Bi-Atrial Geometrical Changes Following Secundum Atrial Septal Defect Closure Using Magnetic Resonance Imaging and Their Effect on Electrical Changes
By Noha Mohamed Gamal, Mohamed Alaa Nady, Amr Mansour Mohamed
Presenter
Amr Mansour
Authors
Noha Mohamed Gamal1, Mohamed Alaa Nady2, Amr Mansour Mohamed3
Affiliation
Assiut University, Egypt1, Assiut University Hospitals, Egypt2, Ain Shams University hospital, Egypt3
View Study Report
TCTAP A-039
Congenital Heart Disease (ASD, PDA, PFO, VSD)
Bi-Atrial Geometrical Changes Following Secundum Atrial Septal Defect Closure Using Magnetic Resonance Imaging and Their Effect on Electrical Changes
Noha Mohamed Gamal1, Mohamed Alaa Nady2, Amr Mansour Mohamed3
Assiut University, Egypt1, Assiut University Hospitals, Egypt2, Ain Shams University hospital, Egypt3
Background
Chronic atrial stretch caused by ASD results in atrial electrical remodeling, which is manifested as prolonged P-wave duration, this has been proposed as a substrate for arrhythmia later on.
Methods
A 12- leads ECG was recorded at a speed of50mm/s and amplitude of 1mV/cm before and 6 months after ASD closure.
Results
Results: Thirty adult patients with isolated Secundum ASD were included (15 patients had transcatheter ASD closure and 15 age and sex-matched group had surgical closure; the majority(66%) were females under the age of 40)
| Device closure | Surgical closure | P-value | |
| P wave maximum (ms) | | | |
| P wave minimum (ms) | | | |
| P wave dispersion (ms) | | | |
Conclusion
Table 2 : Parameters of right atrium among studied patients based type of closure
Data expressed mean (SD). P-value was significant if < 0.05. RA: right atrium
| Device closure | Surgical closure | P-value | |
| RA longitudinal diameter (mm) | | | |
| RA vertical diameter (mm) | | | |
| RA maximum volume (mm) | | | |
| RA minimum volume (mm) | | | |
| RA stroke volume (mm3) | | | |
| RA function (%) | | | |