Abstract

JACC

Lots of interesting abstracts and cases were submitted for TCTAP 2022. Below are the accepted ones after a thorough review by our official reviewers. Don¡¯t miss the opportunity to expand your knowledge and interact with authors as well as virtual participants by sharing your opinion in the comment section!

TCTAP A-071

Role of Serum N-6 Polyunsaturated Fatty Acids in the Development of Acute Coronary Syndromes

By Naoya Inoue, Shuji Morikawa

Presenter

Naoya Inoue

Authors

Naoya Inoue1, Shuji Morikawa1

Affiliation

Chutoen General Medical Center, Japan1
View Study Report
TCTAP A-071
Pharmacology/Pharmacotherapy

Role of Serum N-6 Polyunsaturated Fatty Acids in the Development of Acute Coronary Syndromes

Naoya Inoue1, Shuji Morikawa1

Chutoen General Medical Center, Japan1

Background

Methods

Patient populationThis is a retrospective observational study conducted at a single institution (Chutoen General Medical Center, Kakegawa, Shizuoka, Japan). In total, 433 patients with ischemic heart disease who underwent optical coherence tomography (OCT)-guided PCI at our institution from September 2014 to September 2021 were retrospectively evaluated. ACS included AMI and unstable angina. AMI was defined as a transient increase in the MB fraction of creatine kinase to a threshold that is three times higher than the 99th percentile of the upper reference limit after PCI with ischemic symptoms or typical electrocardiographic changes. Unstable angina was defined as angina at rest and accelerated exertional angina combined with typical electrographic changes. The exclusion criteria were patients with lipid and PUFAs data examined on a day different from the day of PCI. Patients with ACS for more than 24 h after onset, stable circulatory status, and concomitant heart failure were excluded from the analysis based on the Japanese Circulation Society 2018 Guideline on the Diagnosis and Treatment of Acute Coronary Syndrome. The patients (n = 150) were divided into two groups for the final analysis: those who underwent PCI for non-emergent conditions (n = 132, staged group) and those who underwent PCI for ACS (n = 18, ACS group).This study was performed in accordance with the standards of the Declaration of Helsinki and the current ethical guidelines, and it was approved by the institutional ethics board. A written informed consent was not obtained from the patients because this was not a clinical trial and data were retrospective in nature and were analyzed anonymously.

Results

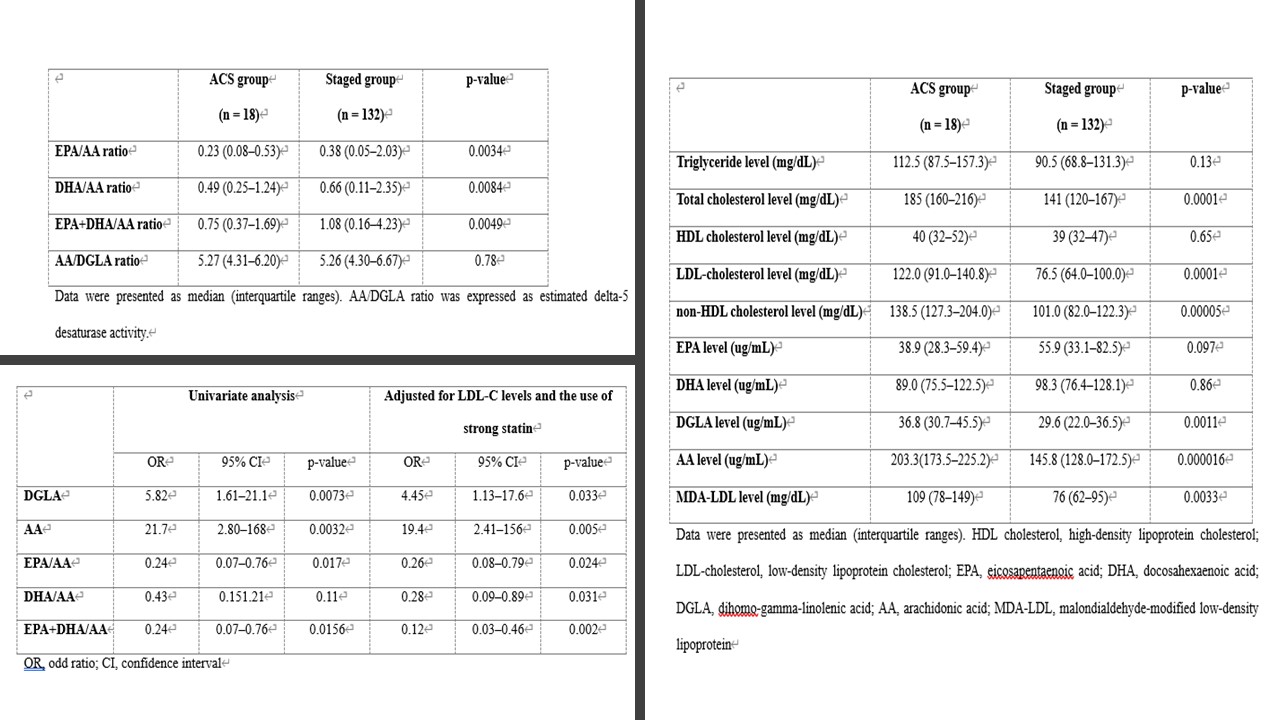
Comparison of each lipid and PUFAs levels in the staged and ACS groupsFIG1 shows the comparison of each lipid fraction between the ACS and staged groups. As shown FIG1there were no significant differences in triglyceride, HDL-C, EPA, and docosahexaenoic acid (DHA) levels. In addition, the ACS group had significantly higher total cholesterol, LDL-C, non-HDL-C, and MDA-LDL levels than the staged group, as shown in FIG1. Moreover, there was no statistical difference in terms of the levels of EPA and DHA, which are n-3 PUFAs (EPA: 38.9 vs. 55.5, p=0.097; DHA: 88.95 vs. 98.25, p=0.86, respectively). By contrast, the ACS group had significantly higher DGLA and AA levels than the staged group (DGLA: 36.75 vs. 29.55, p=0.0011, AA: 203.30 vs. 145.75, p=0.000016). EPA/AA, DHA/AA, EPA+DHA/AA, and AA/DGLA ratiosTable 3 shows the PUFA ratios. The ACS group had lower EPA, DHA, and EPA+DHA-to-AA ratios than the staged group, as shown in FIG1 (EPA/AA: p=0.00342, DHA/AA: p=0.0084, EPA+DHA/AA: p=0.0049). In addition, the AA/DGLA ratio, which was presented as the estimated delta-5 desaturase activity (D5D), did not significantly differ.
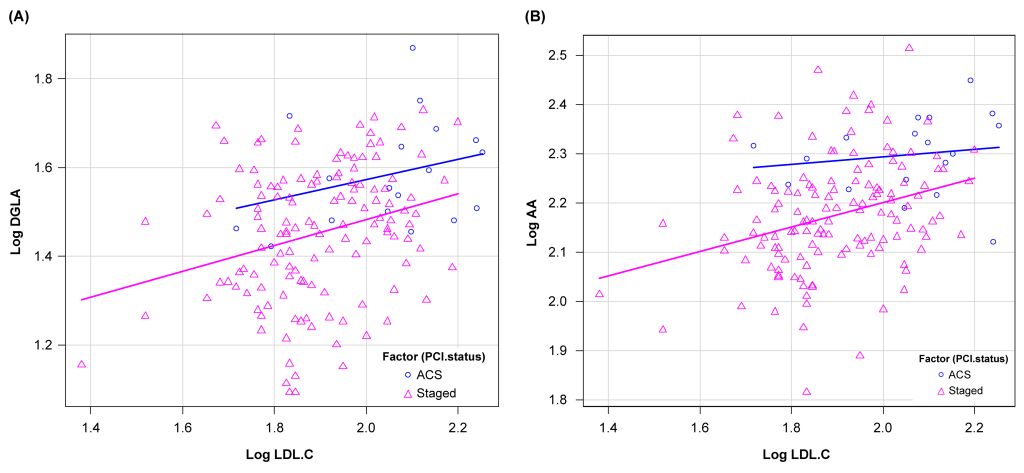
 Effect of DGLA and AA on ACS with consideration of the difference in LDL-C levels and the use of strong statinsWe performed ANCOVA to analyze the effect of DGLA and AA on the development of ACS, with consideration of the difference in LDL-C levels (FIG2). Results showed statistically significant differences in DGLA and AA levels between the two groups based on ANCOVA adjusted for LDL-C levels (DGLA: p=0.022, AA: p=0.0028).In addition, univariate and multivariate analyses were performed to compare the DGLA and AA values and the n-3PUFA/AA ratios between the ACS and staged groups with or without strong statin and LDL-C levels (FIG1). Hence, the adjusted ORs were 4.45 in DGLA levels (95%CI: 1.13–17.6, p=0.033), 19.4 in AA levels(95% CI: 2.41–156, p=0.005), and 0.26in EPA/AA ratios (95% CI: 0.08-0.79, p=0.024).


Conclusion

The ACS group had significantly higher AA and DGLA levels than the staged group. This result was consistent even after adjusting for the effects of confounding factors such as use of strong statins and LDL-C levels. Therefore, excess serum n-6 PUFAs levels may be a risk factor for the development of ACS. In addition, supplementation with n-3 PUFAs may not be necessary for the prevention of ACS.